You can not select more than 25 topics
Topics must start with a letter or number, can include dashes ('-') and can be up to 35 characters long.
|
|
1 year ago | |
|---|---|---|
| c-colours@2974d506e9 | 1 year ago | |
| treesitter-analysis | 1 year ago | |
| README.md | 1 year ago | |
| commitactivityheatmap.png | 1 year ago | |
| justsetuptest.py | 1 year ago | |
| read_db.py | 1 year ago | |
| requirements.txt | 1 year ago | |
| store_history.py | 1 year ago | |
| treeplot.py | 1 year ago | |
| window.py | 1 year ago | |
README.md
All source code for cosc datavisualisation project.
store_history.py- script for walking a git history and storing deltas in an SQLite3 database
treesitter-analysis- C++ program for walking a source directory and analysing the C code contained. Statistics on every comment and function declaration are stored to an SQLite database.
window.py- Entry point to the treemap plotting program.
treeplot.pyplot drawing functionality using Skiaread_db.pyfunctions for copying attributes from a database into the treemap
Usage WARNING: MULTI-STAGE BUILD
- Create a database using
treesitter-analysisorstore_history.py - Clone c-colours and compile the python library, copy the resulting
.sointo the same directory aswindow.py - Edit window.py to load the data you want
pip install -r requirements.txt- Run window.py
- To save the currently presented image mash the S key until "Saving" is printed to the console. Note PDF results are not fully flushed until the program exists for some reason.
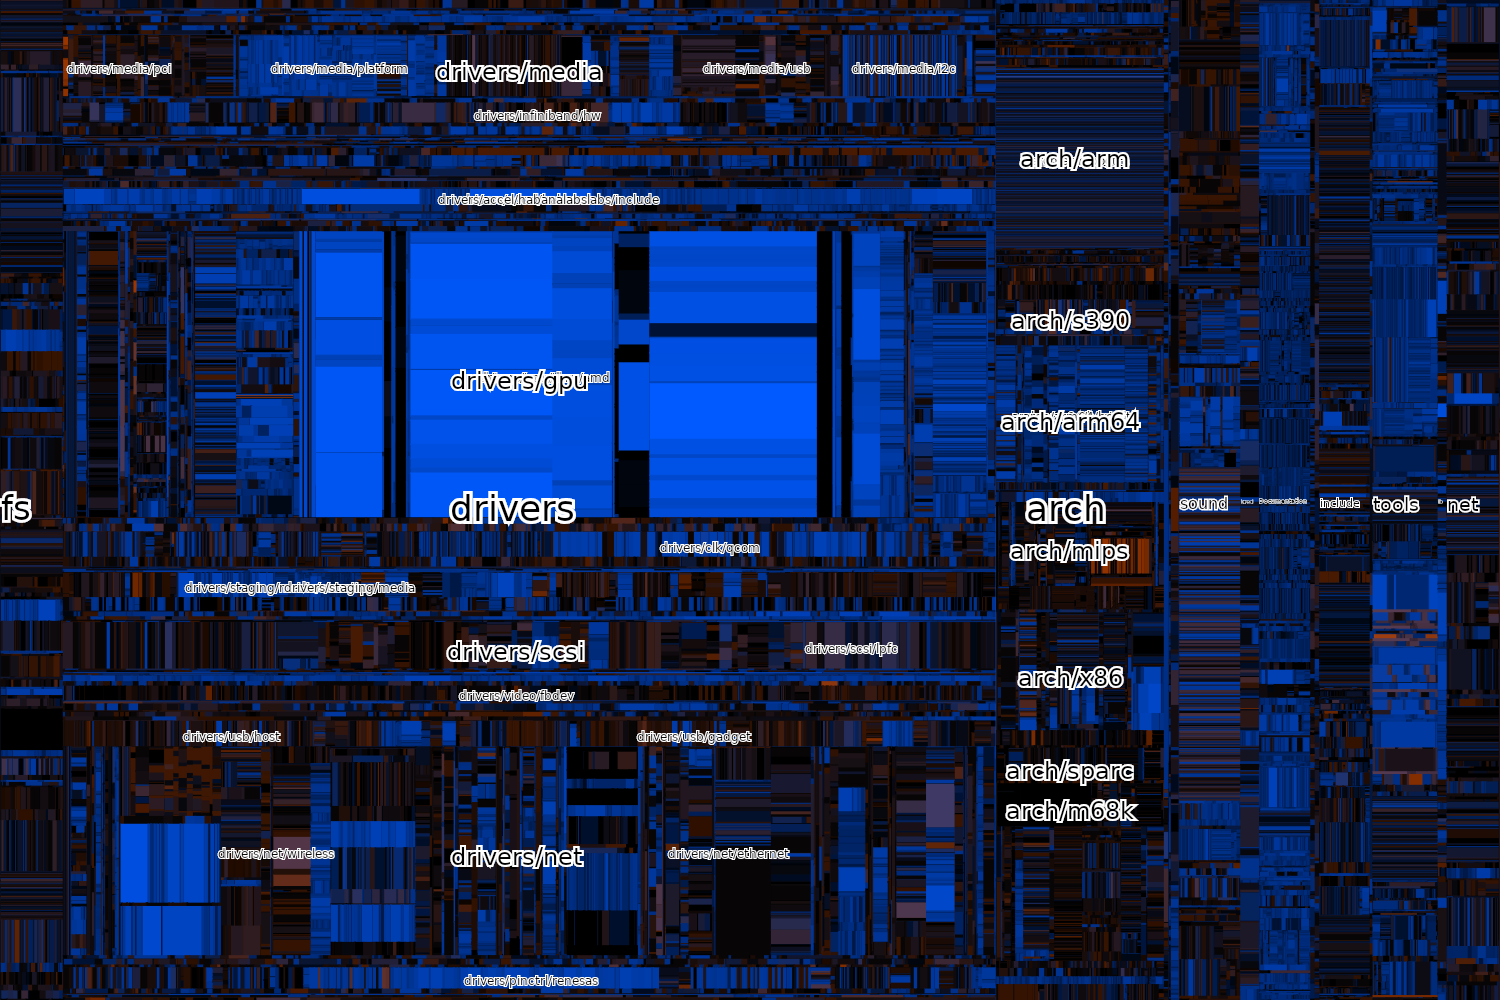
Above is a Tree-heatmap of activity in the linux kernel from the last 5 years. REd means deletion, blue means addition.